mirror of
https://github.com/cloudnativelabs/kube-router.git
synced 2025-09-24 01:21:06 +02:00
105 lines
3.9 KiB
Markdown
105 lines
3.9 KiB
Markdown
# Metrics
|
|
|
|
## Scraping kube-router metrics with Prometheus
|
|
|
|
The scope of this document is to describe how to setup the
|
|
[annotations](https://kubernetes.io/docs/concepts/overview/working-with-objects/annotations/) needed for
|
|
[Prometheus](https://prometheus.io/) to use
|
|
[Kubernetes SD](https://prometheus.io/docs/prometheus/latest/configuration/configuration/#<kubernetes_sd_config>) to
|
|
discover & scape kube-router [pods](https://kubernetes.io/docs/concepts/workloads/pods/pod/).
|
|
|
|
For help with installing Prometheus please see their [docs](https://prometheus.io/docs/introduction/overview/)
|
|
|
|
Metrics options:
|
|
|
|
```sh
|
|
--metrics-path string Path to serve Prometheus metrics on ( default: /metrics )
|
|
--metrics-port uint16 <0-65535> Prometheus metrics port to use ( default: 0, disabled )
|
|
```
|
|
|
|
To enable kube-router metrics, start kube-router with `--metrics-port` and provide a port over 0
|
|
|
|
Metrics is generally exported at the same rate as the sync period for each service. Service metrics are exported real-time.
|
|
|
|
The default values unless other specified is
|
|
|
|
* iptables-sync-period - `1 min``
|
|
* routes-sync-period - `1 min``
|
|
|
|
By enabling
|
|
[Kubernetes SD](https://prometheus.io/docs/prometheus/latest/configuration/configuration/#<kubernetes_sd_config>) in
|
|
Prometheus configuration & adding required annotations Prometheus can automaticly discover & scrape kube-router metrics
|
|
|
|
## Version notes
|
|
|
|
kube-router v0.2.4 received a metrics overhaul where some metrics were changed into histograms, additional metrics were
|
|
also added. Please make sure you are using the latest dashboard version with versions => v0.2.4
|
|
|
|
kube-router 0.1.0-rc2 and upwards supports the runtime configuration for controlling where to expose the metrics. If
|
|
you are using a older version, metrics path & port is locked to `/metrics` & `8080`
|
|
|
|
## Available metrics
|
|
|
|
If metrics is enabled only services that are running have their metrics exposed
|
|
|
|
The following metrics is exposed by kube-router prefixed by `kube_router_`
|
|
|
|
### run-router = true
|
|
|
|
* controller_bgp_peers
|
|
Number of BGP peers of the instance
|
|
* controller_bgp_advertisements_received
|
|
Total number of BGP advertisements received since kube-router started
|
|
* controller_bgp_advertisements_sent
|
|
Total number of BGP advertisements sent since kube-router started
|
|
* controller_bgp_internal_peers_sync_time
|
|
Time it took for the BGP internal peer sync loop to complete
|
|
* controller_routes_sync_time
|
|
Time it took for controller to sync routes
|
|
|
|
### run-firewall=true
|
|
|
|
* controller_iptables_sync_time
|
|
Time it took for the iptables sync loop to complete
|
|
* controller_policy_chains_sync_time
|
|
Time it took for controller to sync policy chains
|
|
|
|
### run-service-proxy = true
|
|
|
|
* controller_ipvs_services_sync_time
|
|
Time it took for the ipvs sync loop to complete
|
|
* controller_ipvs_services
|
|
The number of ipvs services in the instance
|
|
* controller_ipvs_metrics_export_time
|
|
The time it took to run the metrics export for IPVS services
|
|
* service_total_connections
|
|
Total connections made to the service since creation
|
|
* service_packets_in
|
|
Total n/o packets received by service
|
|
* service_packets_out
|
|
Total n/o packets sent by service
|
|
* service_bytes_in
|
|
Total bytes received by the service
|
|
* service_bytes_out
|
|
Total bytes sent by the service
|
|
* service_pps_in
|
|
Incoming packets per second
|
|
* service_pps_out
|
|
Outgoing packets per second
|
|
* service_cps
|
|
Connections per second
|
|
* service_bps_in
|
|
Incoming bytes per second
|
|
* service_bps_out
|
|
Outgoing bytes per second
|
|
|
|
To get a grouped list of CPS for each service a Prometheus query could look like this e.g:
|
|
`sum(kube_router_service_cps) by (svc_namespace, service_name)`
|
|
|
|
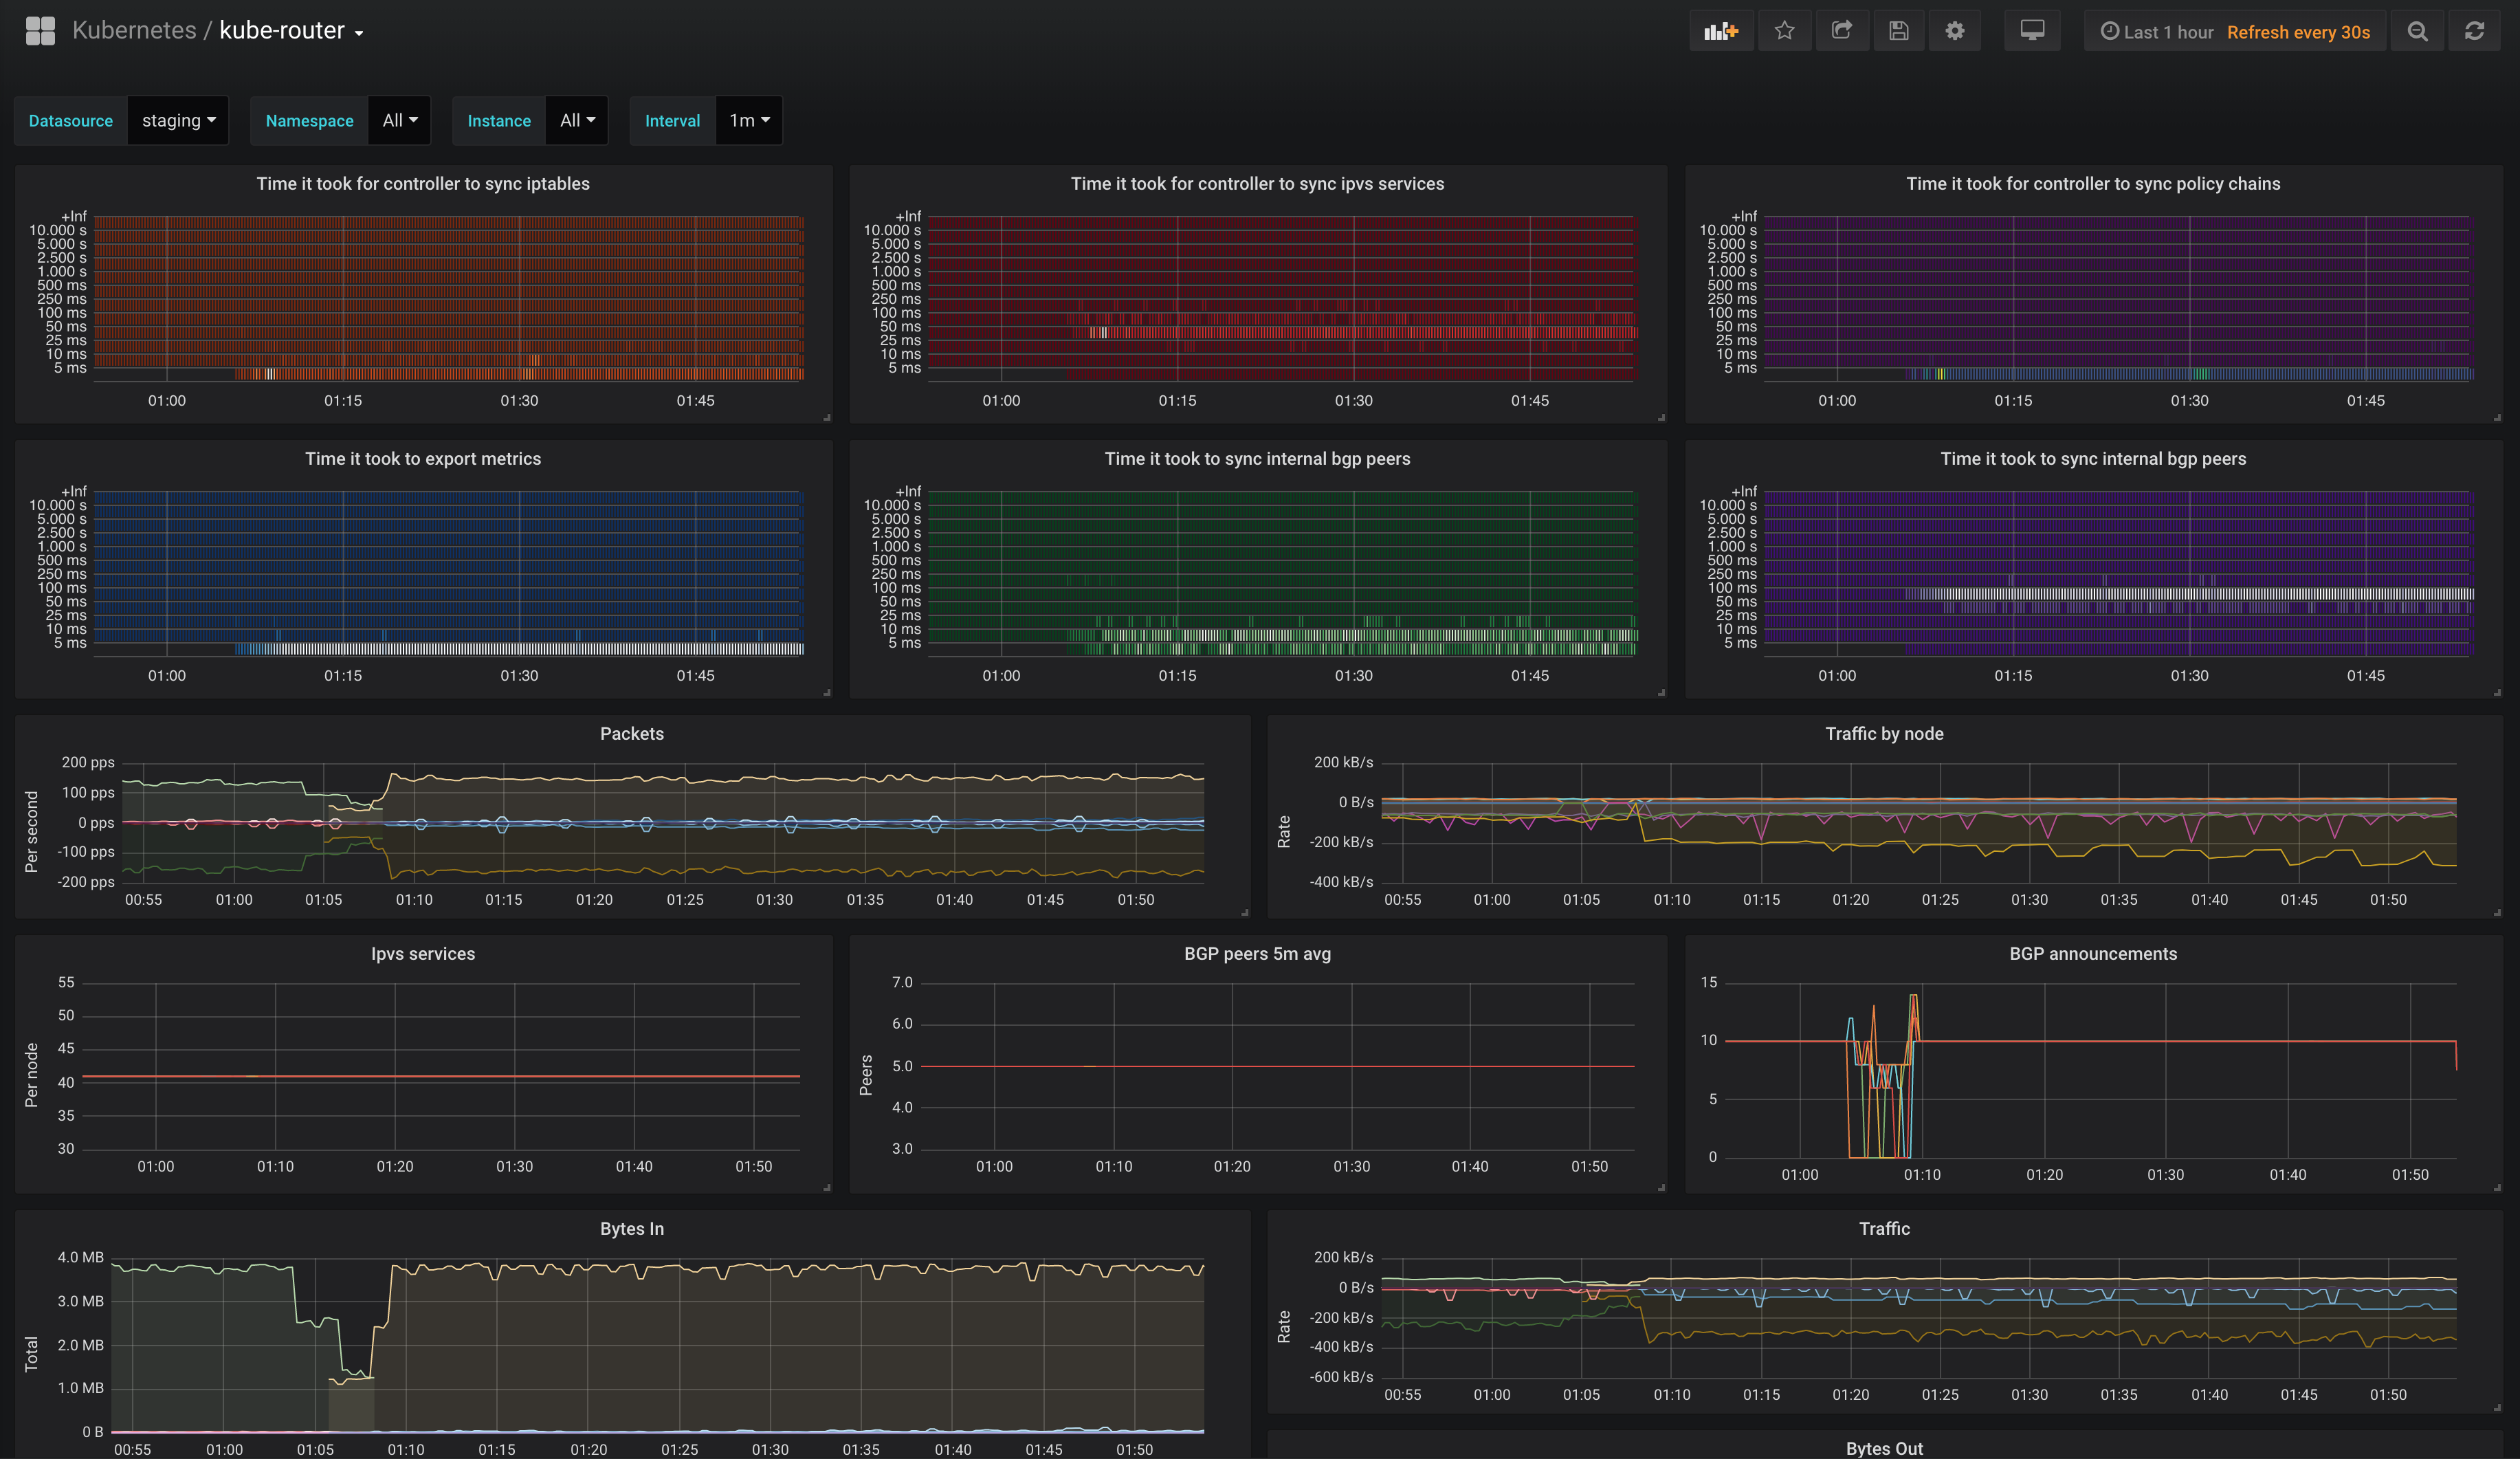
## Grafana Dashboard
|
|
|
|
This repo contains a example
|
|
[Grafana dashboard](https://raw.githubusercontent.com/cloudnativelabs/kube-router/master/dashboard/kube-router.json)
|
|
utilizing all the above exposed metrics from kube-router.
|
|
|